Case Study:Customer 1
Goal
- SEO and PPC Campaigns for HVAC.
- Non-reporting/RYNOtrax client – no lead volume to report on for campaign.
- As the SEO campaign matured and organic page rankings increased, client was less reliant on supplementing with PPC.
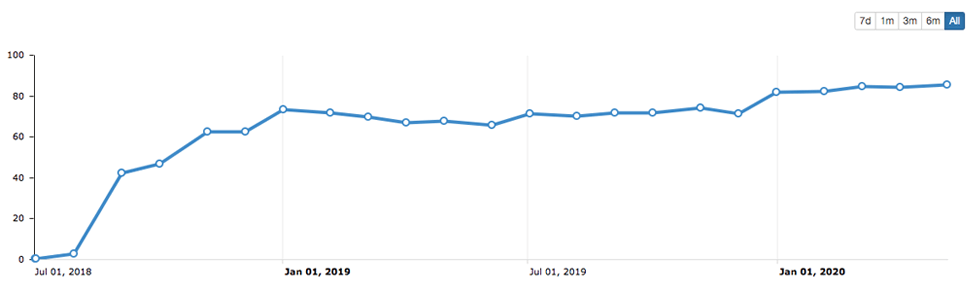
SEO Keyword Ranking Visibility Evolution
| Campaign Details | Visibility Percentage |
|---|---|
| Baseline Non-RYNO Site (Pre-Launch) | .32% |
| Month 1 (RYNO Site Launch) | 2.73% |
| Month 3 | 46.67% |
| Month 6 | 73.5% |
| Month 12 | 71.35% |
| Month 18 | 82.05% |
RYNOtrax Key Metric Insights
| Baseline (Pre-Launch) | Month 1 | Month 3 | Month 6 | Month 12 | Month 18 | Current (Month 22) | |
|---|---|---|---|---|---|---|---|
| Organic Traffic | 45% | 4% | 9% | 8% | 7% | 5% | 5% |
| PPC Traffic | 1% | 5% | 1% | 2% | 3% | 4% | 5% |
| Conversion Rate | 0% | 34.74% | 36.66% | 37.36% | 27.04% | 28.86% | 30.86% |
| Total Leads | 2 | 6 | 4 | 3 | 2 | 1 | 0 |
| Cost Per Lead | $3 | $7 | $1 | $2 | $3 | $4 | $5 |
Lead Volume Over The Past 18 Months – Calls Only
296
Highest Lead Volume
July 2019
62
Lowest Lead Volume
March 2020
128
Average Lead Volume
Leads/Month
Website Traffic Analytics Data:
Year at a Glance (May 2019 – May 2020)81%
RYNO Internet Marketing Website Traffic
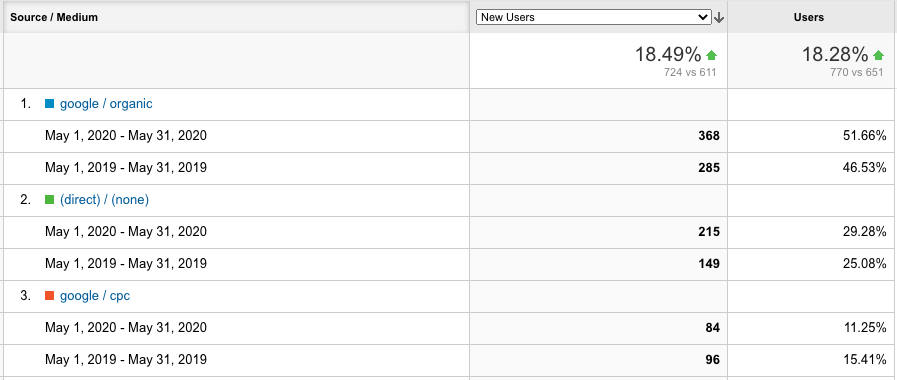
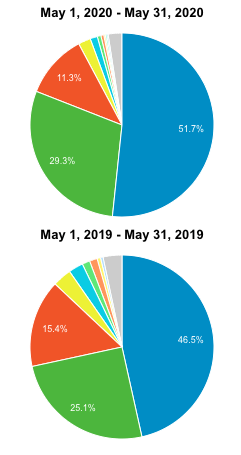
Organic (SEO) and CPC (PPC) Traffic accounted for 81% of all website traffic in May 2020. This is up from 71.6% in May 2019.
29.12%
New User Visits
Organic Traffic (SEO) saw an increase of 31.17% from all users and 29.12% from new users in May 2020 versus May 2019.
13.73%
PPC Traffic
CPC (Cost Per Click / PPC) Traffic decreased in May 2020. Budget was adjusted to account for decreased search trends/demand. This decrease was offset by the increase in organic rankings.